Water resources monitoring for business processes and management
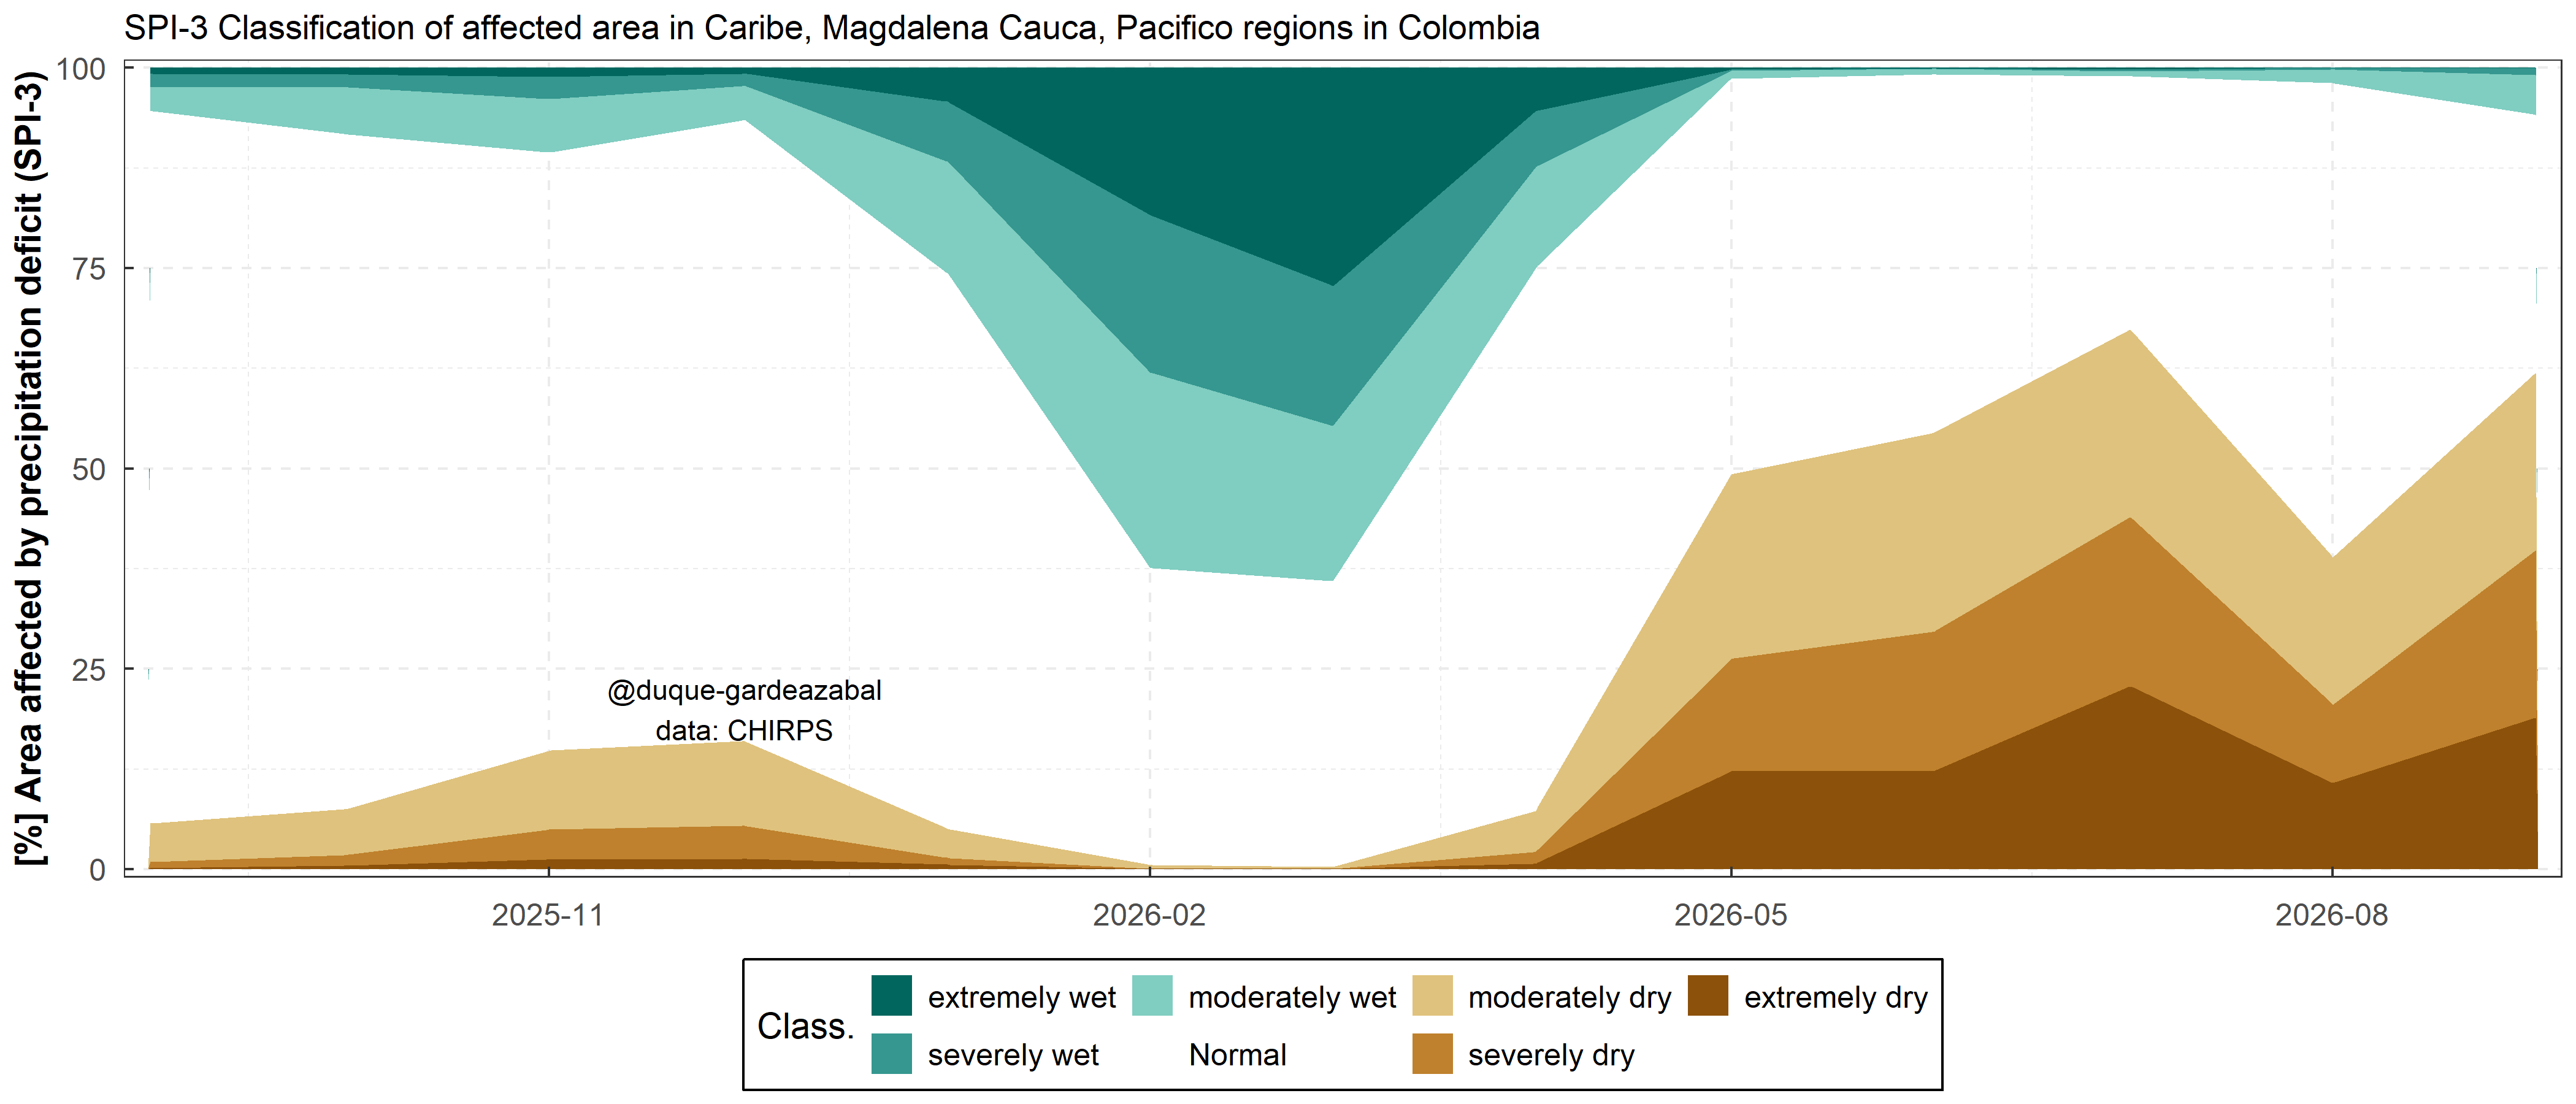
Figure 1:Rainfall wetness and dryness conditions in the last 12 months for Northwestern South America.

Figure 1:Last 12 months of SPI-3 over Colombia, classified according to the WMO.
Business operations and production can be impacted by rainfall and water supply variability. Water can be a risk either by excess or deficiency, generating disruption in production. Then monitoring conditions over a region with the Standardise Precipitation Index (SPI) or other drought- or wetness-oriented indices is useful for decision making. Examples of disruptions can go from undelivered commodities because of weather-related trasport issues, reduction of available energy because of droughts or reduced wind speed, or reduction of yields because of droughts as well. Figure 1 shows the evolution of precipitation conditions (i.e. variability) in the last 12 months for a region in Colombia. This helps businesses realise the recent challenges in their operations, and in conjunction with climate forecasts, make informed-decisions.
Past coditions inform about the history of the region, helping to establish extremes and worst case scenarios. Figure 3 shows the recent historical conditions, and a zoom to an extreme dry period, on the region of the Orinoco in Colombia. The understanding of the probability and scale of these extremes help planning operations and plans of action to tackle the disruptions in operations.
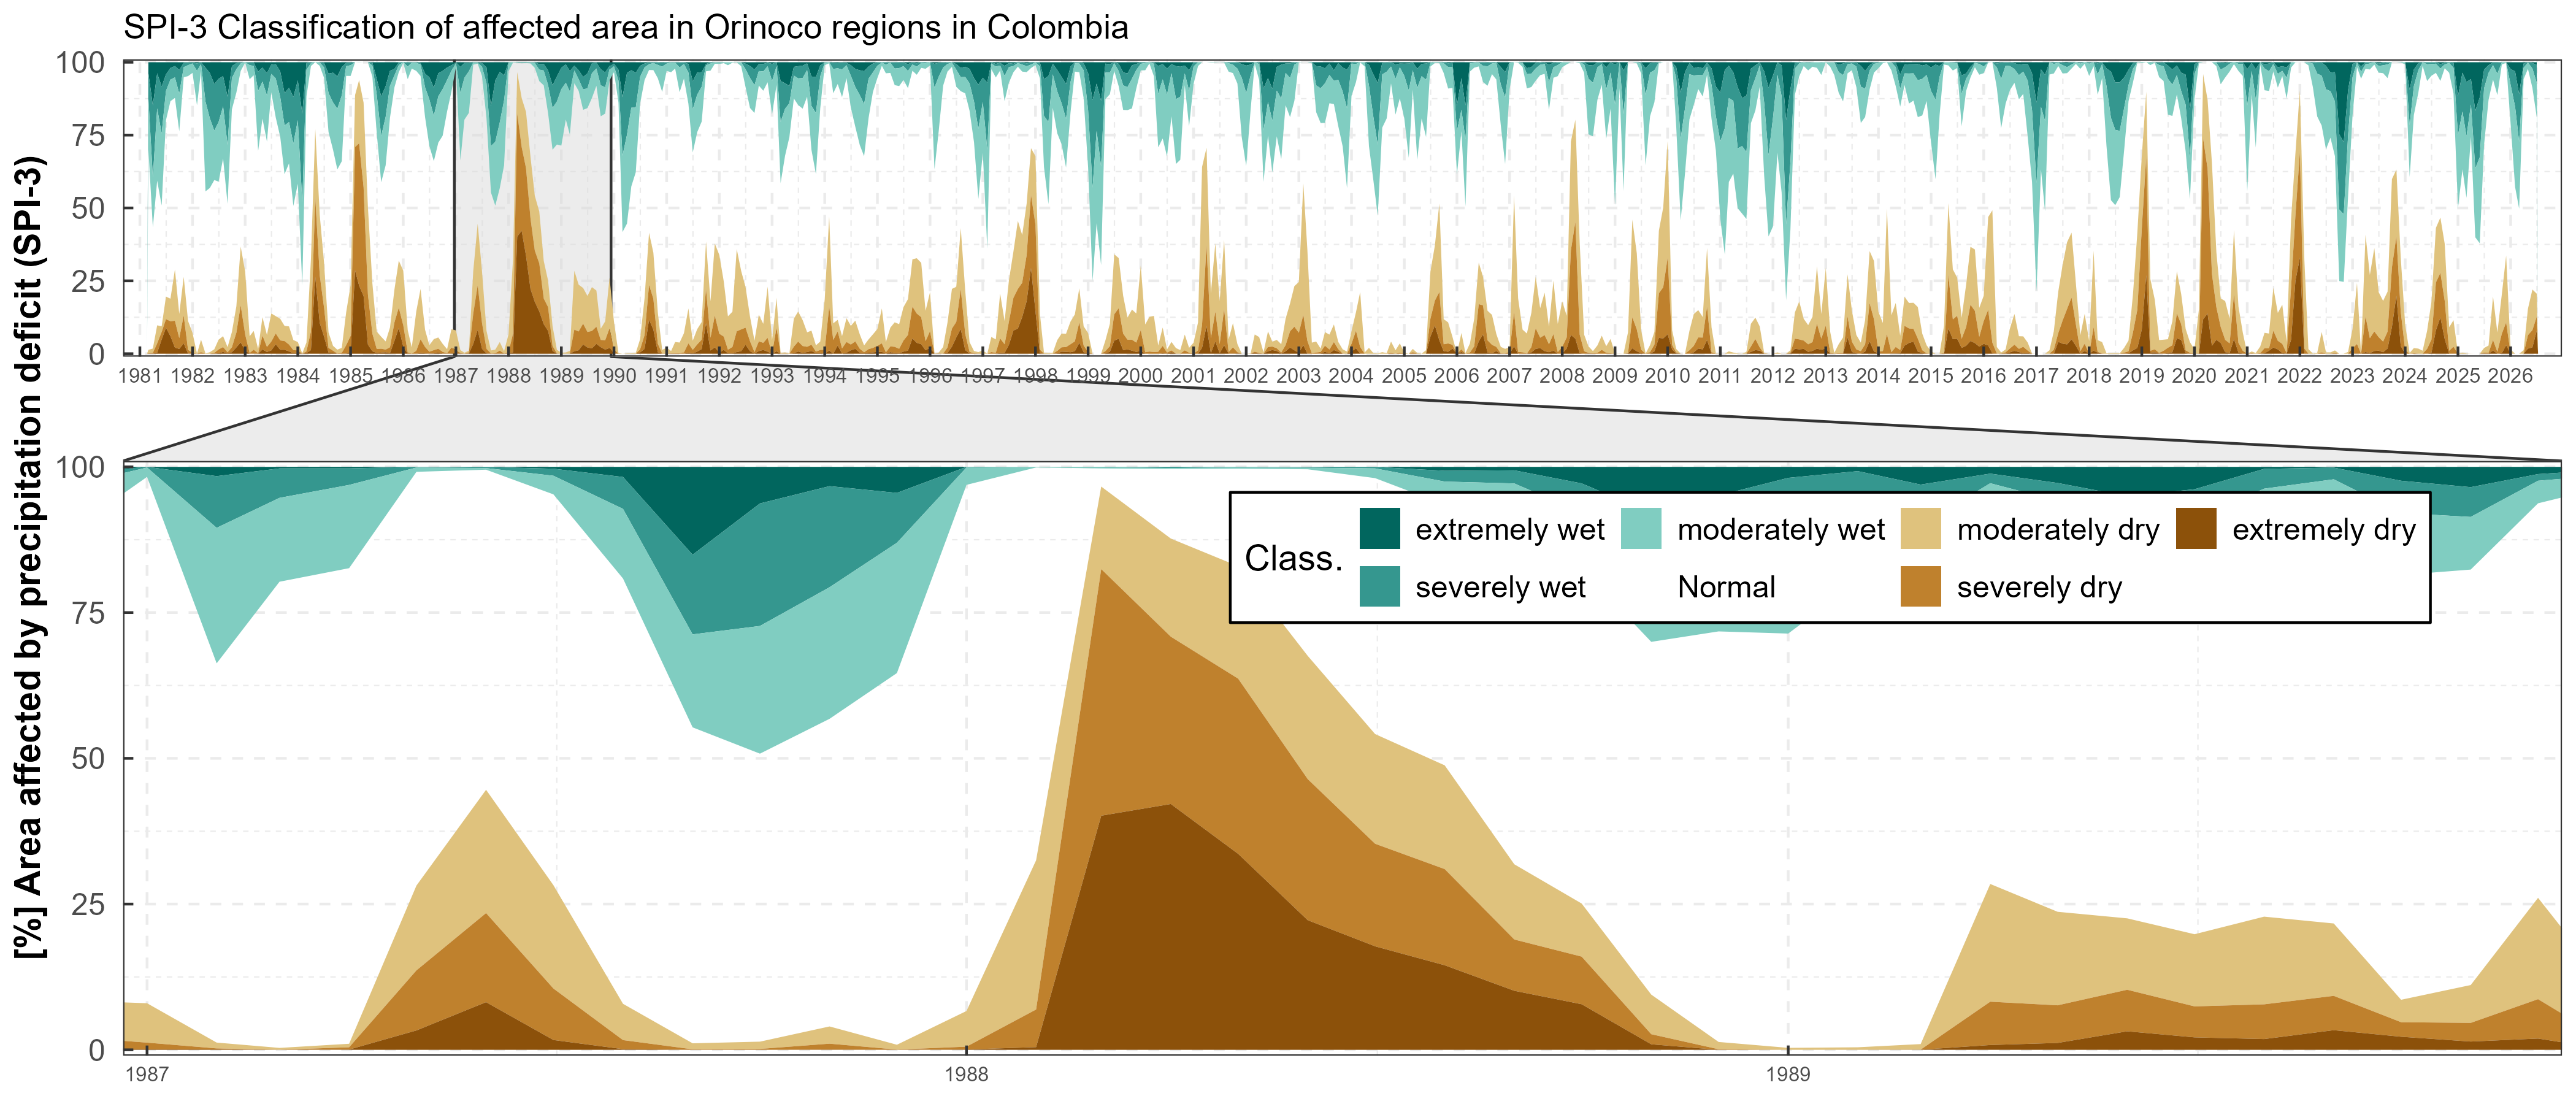
Figure 3:Time series of classified SPI-3 for the last 46 years in a region of Colombia and a zoom of the evolution over 3 years.